Marker Size Control
Control the size of plot markers either uniformly across all points or individually based on your data. This is useful for creating bubble charts where marker size represents a third dimension of data.
Static Marker Sizes
Set a uniform marker size for all points in a plot using the mark_size parameter on AddPlot:
from texer import PGFPlot, Axis, AddPlot, Coordinates, evaluate

plot = PGFPlot(
    Axis(
        xlabel="X",
        ylabel="Y",
        title="Static Marker Size (5pt)",
        grid=True,
        plots=[
            AddPlot(
                color="blue",
                mark="*",
                mark_size=5,  # All markers will be 5pt
                only_marks=True,
                coords=Coordinates(x=[1, 2, 3, 4, 5], y=[2, 4, 3, 5, 4]),
            )
        ],
    )
)

print(evaluate(plot, {}))
Output:
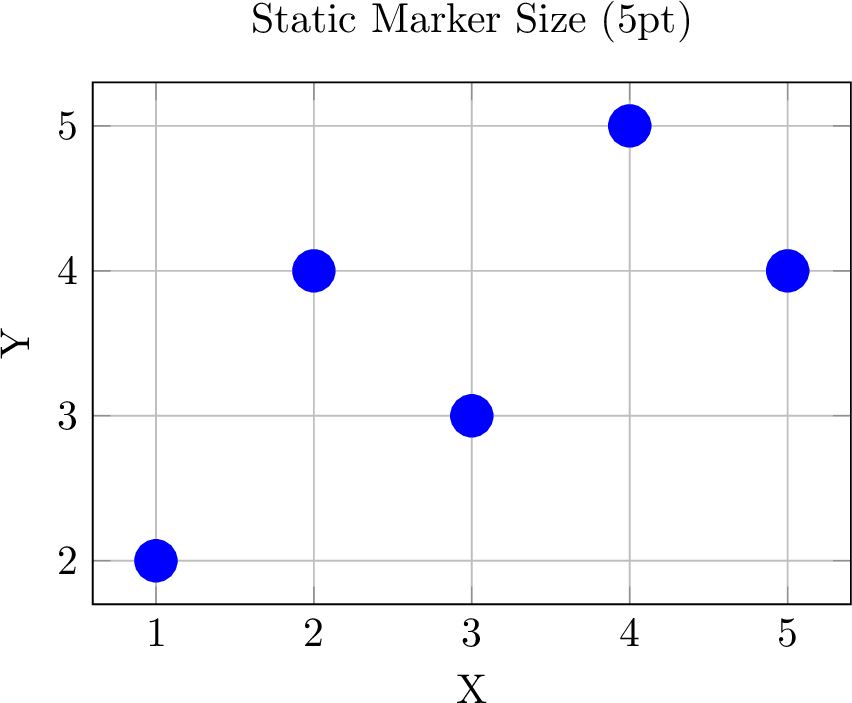
The mark_size parameter accepts:
- Numeric values (automatically converted to pt units):
mark_size=5becomes5pt - String values with units:
mark_size="3mm"ormark_size="0.5cm"
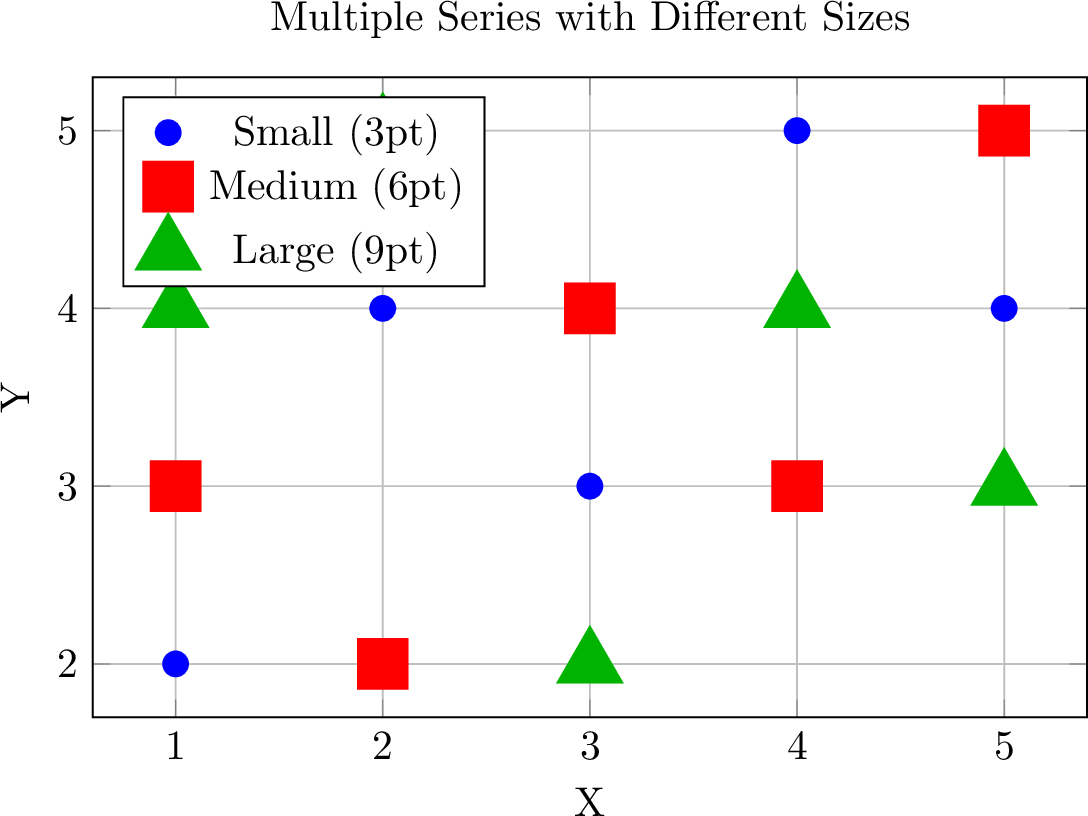
Multiple Series with Different Sizes
Create plots with multiple series, each having different marker sizes:
from texer import PGFPlot, Axis, AddPlot, Coordinates, evaluate

plot = PGFPlot(
    Axis(
        xlabel="X",
        ylabel="Y",
        title="Multiple Series with Different Sizes",
        legend_pos="north west",
        grid=True,
        plots=[
            AddPlot(
                color="blue",
                mark="*",
                mark_size=3,
                only_marks=True,
                coords=Coordinates(x=[1, 2, 3, 4, 5], y=[2, 4, 3, 5, 4]),
            ),
            AddPlot(
                color="red",
                mark="square*",
                mark_size=6,
                only_marks=True,
                coords=Coordinates(x=[1, 2, 3, 4, 5], y=[3, 2, 4, 3, 5]),
            ),
            AddPlot(
                color="green!70!black",
                mark="triangle*",
                mark_size=9,
                only_marks=True,
                coords=Coordinates(x=[1, 2, 3, 4, 5], y=[4, 5, 2, 4, 3]),
            ),
        ],
        legend=["Small (3pt)", "Medium (6pt)", "Large (9pt)"],
    )
)

print(evaluate(plot, {}))
Output:
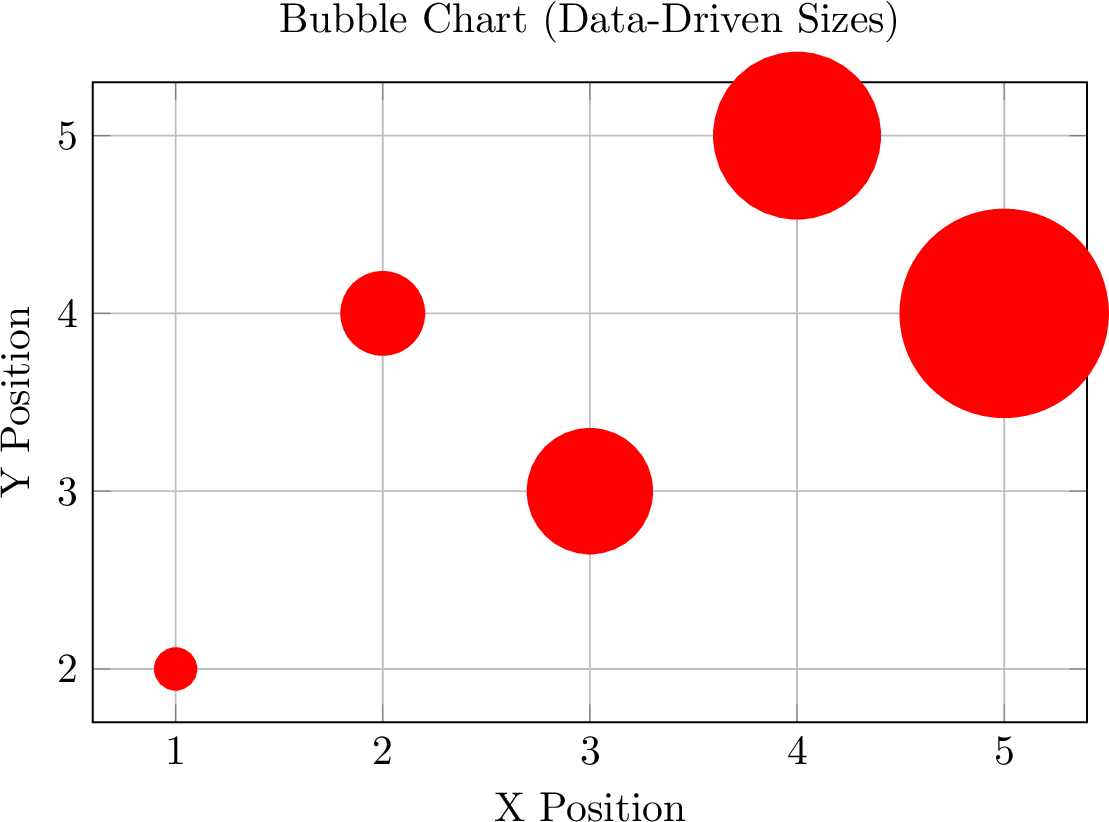
Data-Driven Marker Sizes (Bubble Charts)
For bubble charts, control each marker's size individually based on your data. This requires enabling scatter=True mode:
from texer import PGFPlot, Axis, AddPlot, Coordinates, evaluate

plot = PGFPlot(
    Axis(
        xlabel="X Position",
        ylabel="Y Position",
        title="Bubble Chart (Data-Driven Sizes)",
        grid=True,
        plots=[
            AddPlot(
                color="red",
                mark="*",
                only_marks=True,
                scatter=True,  # Enable scatter mode for per-point sizes
                coords=Coordinates(
                    x=[1, 2, 3, 4, 5],
                    y=[2, 4, 3, 5, 4],
                    marker_size=[5, 10, 15, 20, 25]  # Different size for each point
                ),
            )
        ],
    )
)

print(evaluate(plot, {}))
Output:
This generates coordinates with bracket notation for the marker size metadata:
\addplot[..., scatter, point meta=explicit,
  visualization depends on={\pgfplotspointmeta \as \perpointmarksize},
  scatter/@pre marker code/.append style={/tikz/mark size=\perpointmarksize}
] coordinates {(1, 2) [5] (2, 4) [10] (3, 3) [15] (4, 5) [20] (5, 4) [25]};
Requirements for Data-Driven Sizes
- You must set
scatter=Trueon theAddPlot - Provide
marker_sizeas a list inCoordinatesalongsidexandy - The
marker_sizelist must have the same length asxandy
Quick Bubble Charts with scatter_plot()
Use the convenience function for creating bubble charts with minimal code:
from texer import scatter_plot, evaluate

plot = scatter_plot(
    x=[1, 2, 3, 4, 5],
    y=[2, 4, 3, 5, 4],
    marker_size=[5, 10, 15, 20, 25],
    xlabel="X Value",
    ylabel="Y Value",
    title="Easy Bubble Chart",
    color="green!70!black",
    mark="o"
)

print(evaluate(plot, {}))
Output:
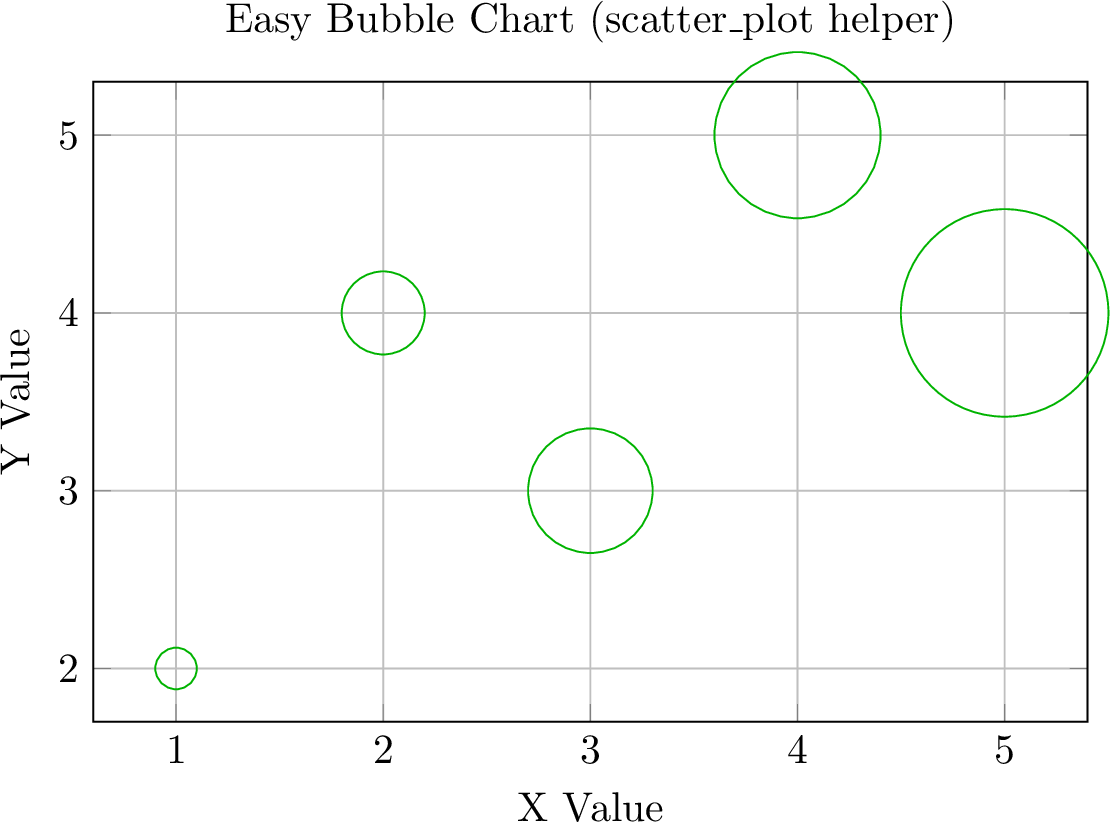
The scatter_plot() helper automatically:
- Enables scatter mode
- Sets
only_marks=True - Configures the marker size visualization
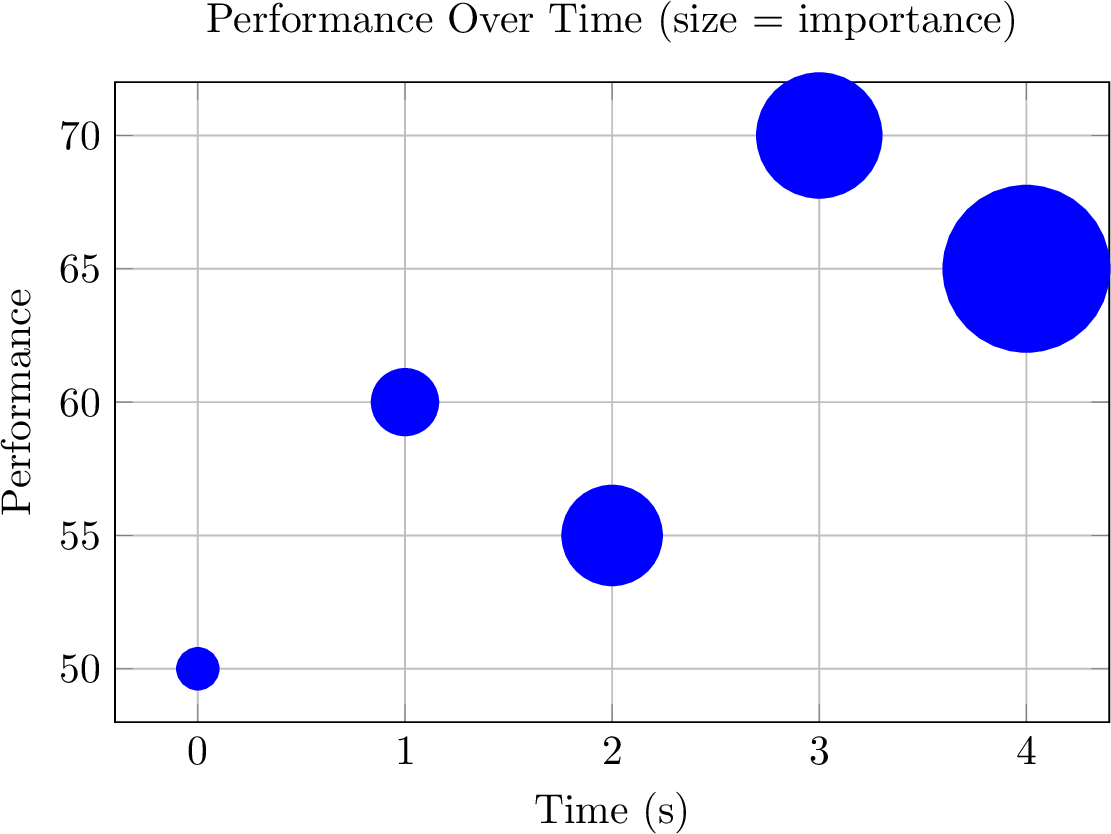
Dynamic Marker Sizes from Data
Marker sizes can be data-driven using Ref and Iter:
from texer import PGFPlot, Axis, AddPlot, Coordinates, Ref, Iter, evaluate

plot = PGFPlot(
    Axis(
        xlabel="Time (s)",
        ylabel="Performance",
        title=Ref("plot_title"),
        grid=True,
        plots=[
            AddPlot(
                color="blue",
                mark="*",
                only_marks=True,
                scatter=True,
                coords=Coordinates(
                    Iter(
                        Ref("measurements"),
                        x=Ref("time"),
                        y=Ref("perf"),
                        marker_size=Ref("importance")
                    )
                ),
            )
        ],
    )
)

data = {
    "plot_title": "Performance Over Time (size = importance)",
    "measurements": [
        {"time": 0, "perf": 50, "importance": 5},
        {"time": 1, "perf": 60, "importance": 8},
        {"time": 2, "perf": 55, "importance": 12},
        {"time": 3, "perf": 70, "importance": 15},
        {"time": 4, "perf": 65, "importance": 20},
    ],
}

print(evaluate(plot, data))
Output:
This pattern is powerful for:
- Visualizing uncertainty or confidence intervals
- Showing importance/weight of data points
- Creating bubble charts from database queries
- Any scenario where a third variable should control point size
API Reference
AddPlot Parameters
| Parameter | Type | Description |
|---|---|---|
mark_size |
float, int, or str |
Static marker size for all points (e.g., 5 or "3mm") |
scatter |
bool |
Enable scatter mode for data-driven marker sizes |
scatter_src |
str |
Control how marker size data is interpreted (default: "explicit") |
Coordinates Parameters
| Parameter | Type | Description |
|---|---|---|
marker_size |
list or Ref |
Individual marker size for each point (requires scatter=True on AddPlot) |
Iter Parameters for Coordinates
When using Iter inside Coordinates, you can specify:
| Parameter | Type | Description |
|---|---|---|
x |
Ref |
Path to x values in each item |
y |
Ref |
Path to y values in each item |
z |
Ref |
Path to z values (for 3D plots) |
marker_size |
Ref |
Path to marker size values in each item |
Notes
- Static vs Data-Driven:
mark_sizeonAddPlotsets a uniform size;marker_sizeinCoordinatesallows per-point sizes - Units: Marker sizes are specified in LaTeX pt units by default
- 3D Support: Data-driven marker sizes also work with 3D scatter plots
- Cannot Combine: Static
mark_sizeand data-drivenmarker_sizecannot be used together in the same plot